YOKABIO

Back to Experiment

Supplementary Information of Experiment

Complete protocols, compositions, verification details, and figures.

Table of Contents

  1. Experimental work content
  2. Details of Buffer Composition
  3. Details of the DNA oscillation verification experiment
  4. DNA oscillations with amino acid–modified template DNA
  5. 5. Expression and purification of ttRecJ
  6. Reference

1. Experimental work content

2. Details of Buffer Composition

ComponentStock conc.Add (µL)Final in 4×Final in 1×
Tris-HCl (pH 8.8)1000 mM4080 mM20 mM
(NH4)2SO41000 mM2040 mM10 mM
KCl1000 mM2040 mM10 mM
NaCl1000 mM100200 mM50 mM
MgSO41000 mM1632 mM8 mM
dNTPs10 mM801.6 mM0.4 mM
Synperonic10 %200.4 %0.1 %
Netrospin220.0080.002
EvaGreen20×100

3. Details of the DNA oscillation verification experiment

3.1 Experiment 3-1

Objective of the experiment;

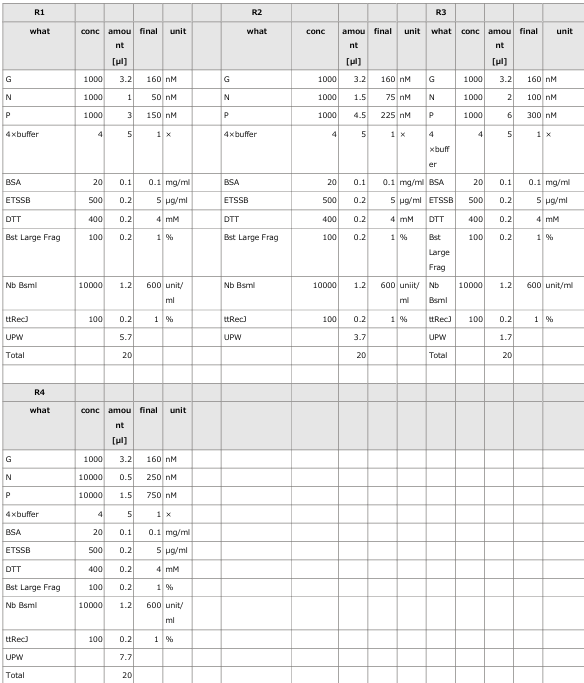
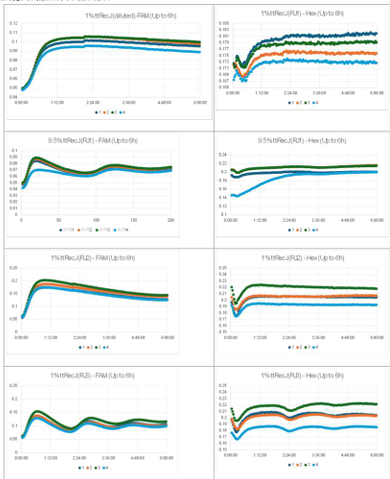
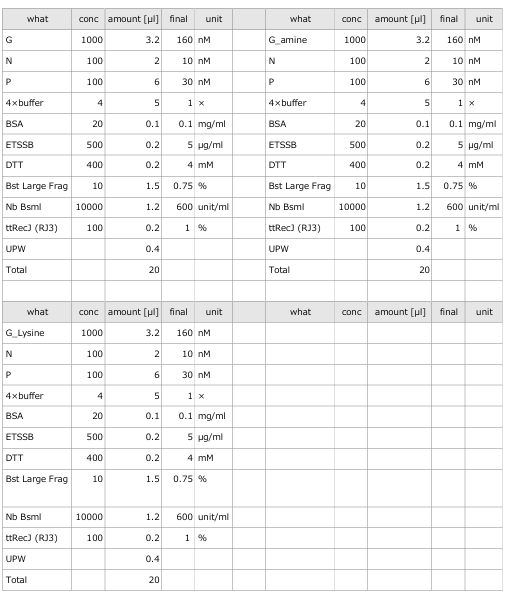
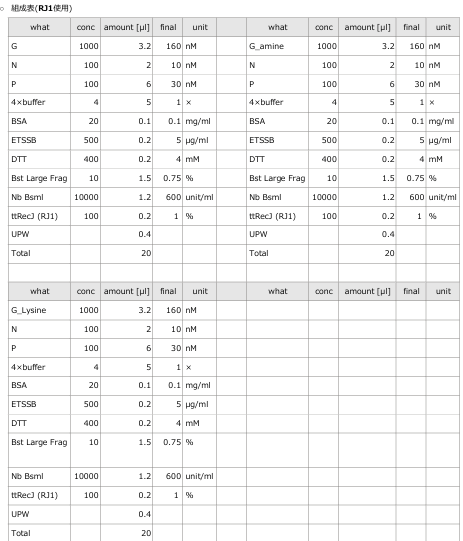
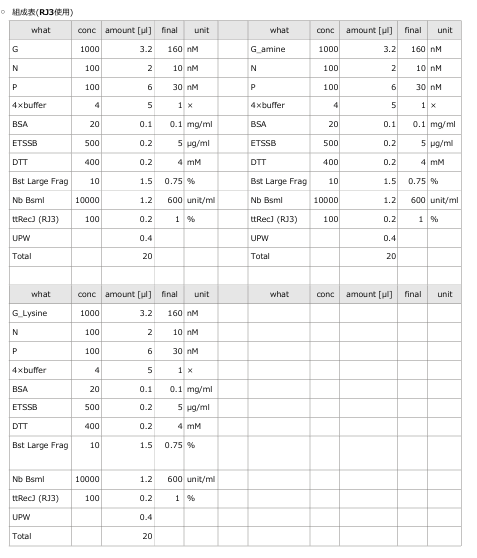
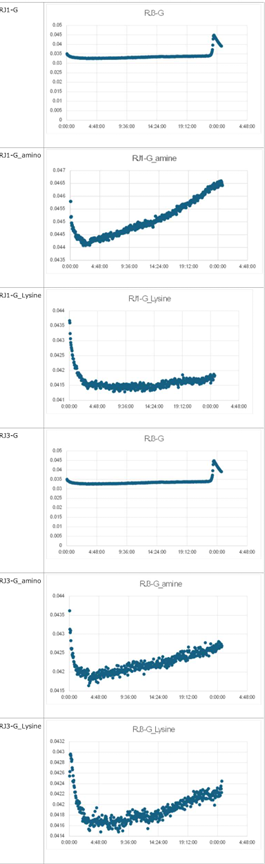
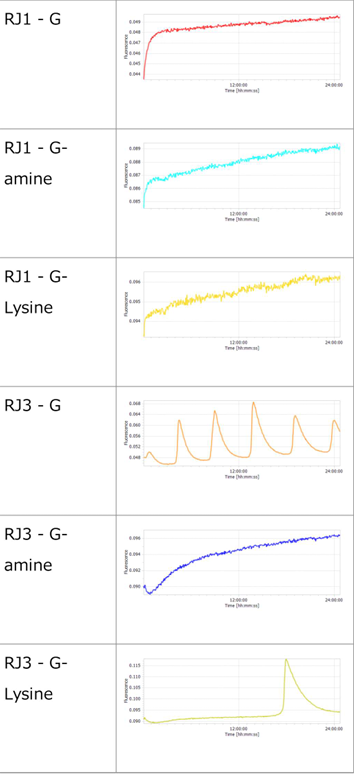
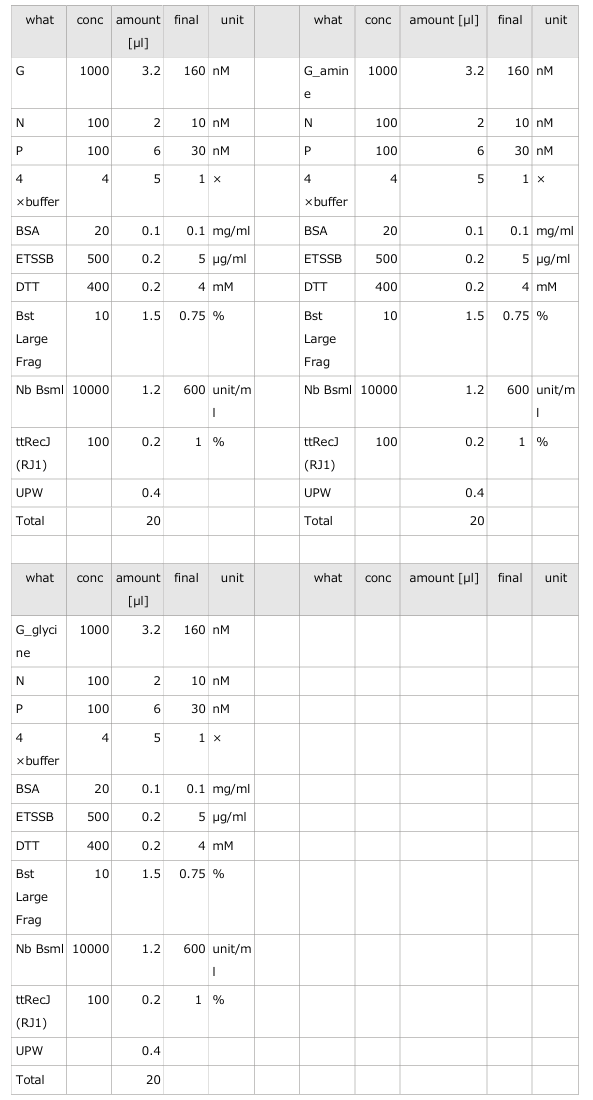
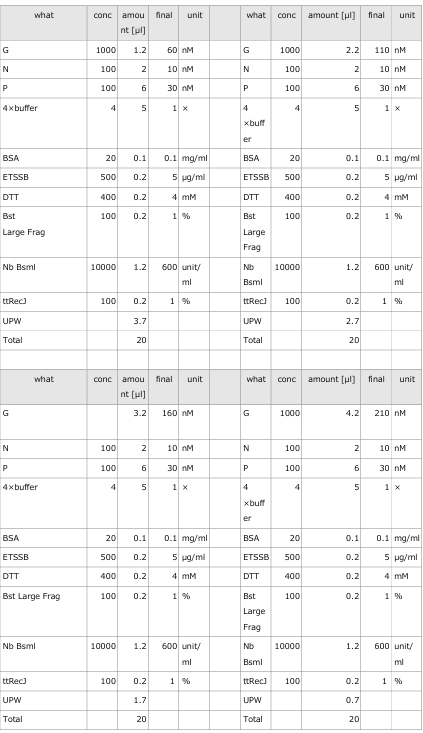
  • The oscillations were investigated using the composition parameters described in the previous study [1].
Experiment 3-1 figure 1 Experiment 3-1 figure 2
Composition table
Graph of experimental results
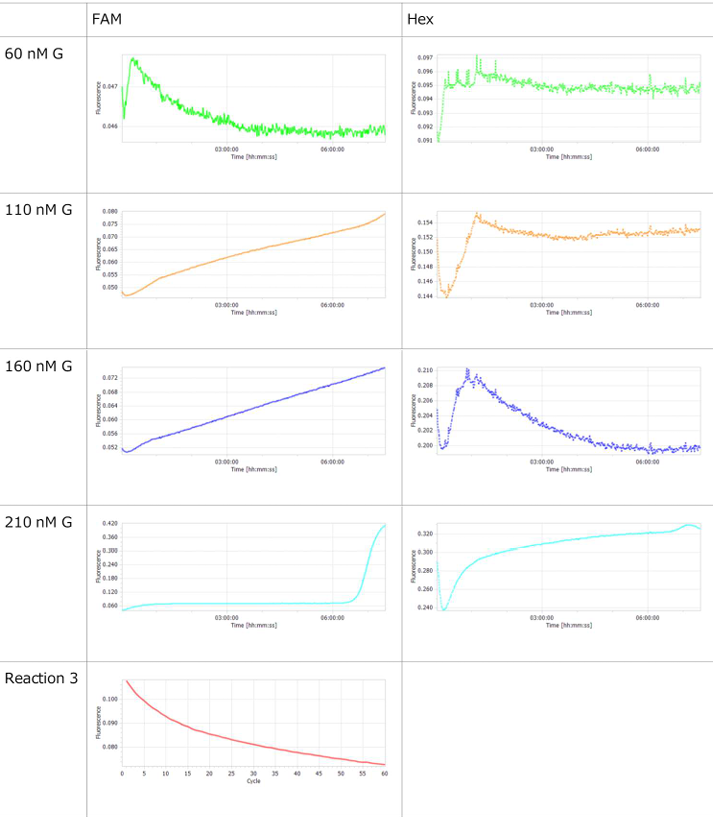
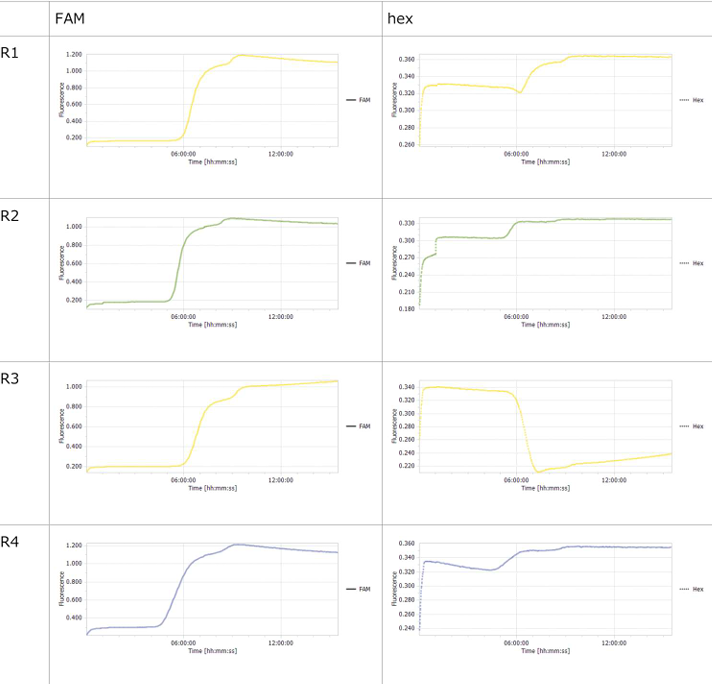
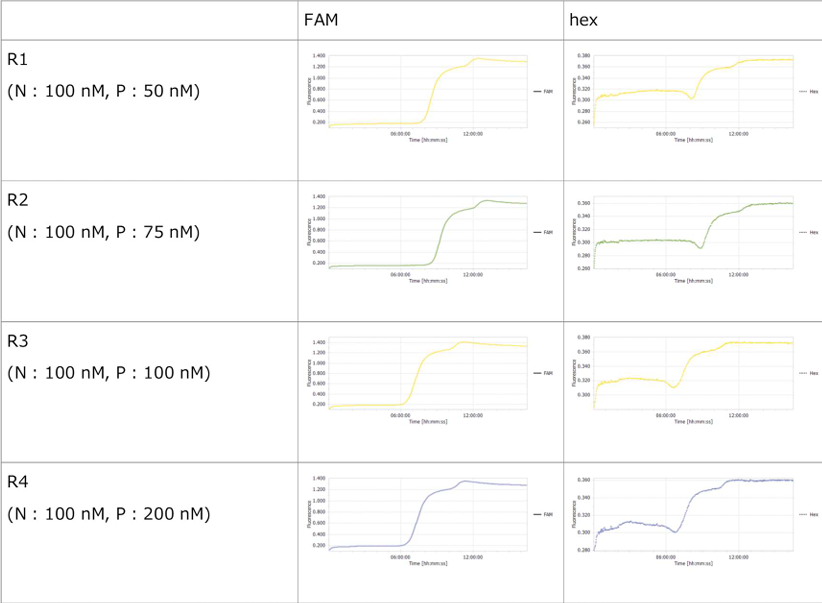
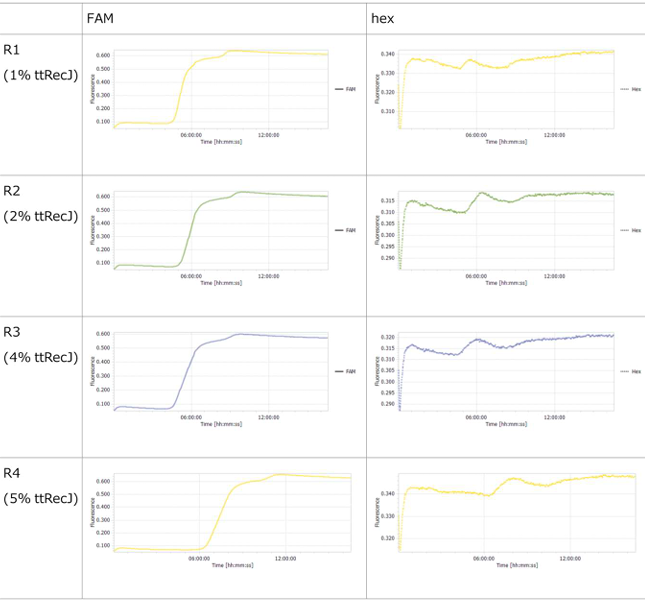
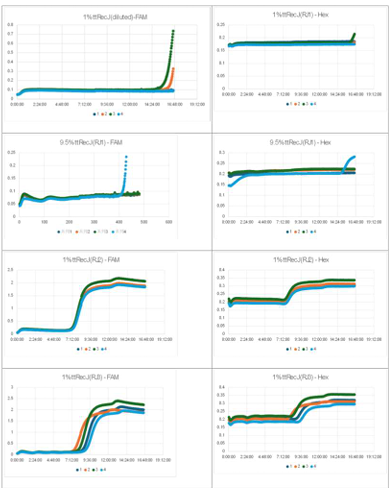
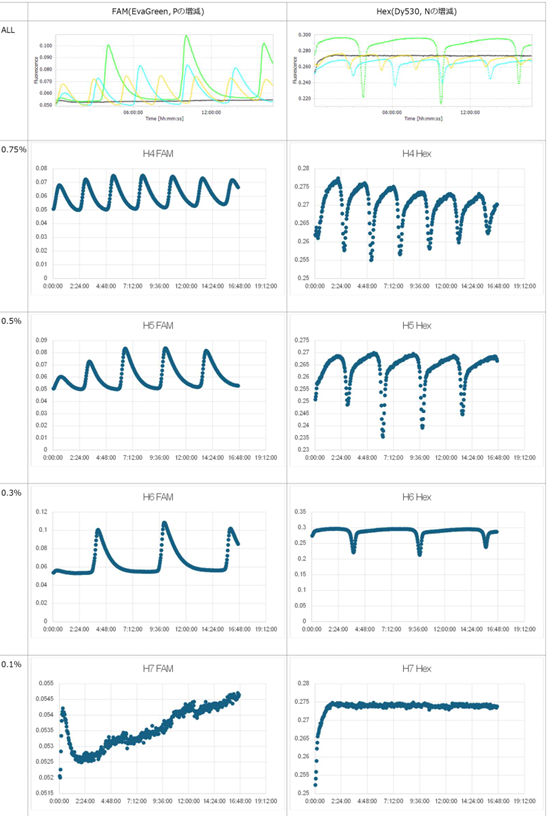
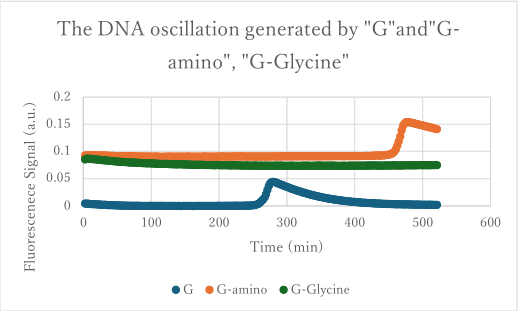
  • Horizontal axis: Time; Vertical axis: Fluorescence intensity.
  • The graph on the left represents P, while the graph on the right represents N.
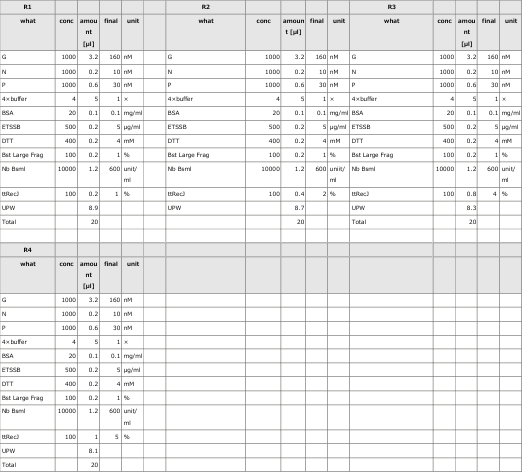
  • Oscillatory behavior was examined under conditions where the concentration of the template DNA, G, was set to 60 nM, 110 nM, 160 nM, and 210 nM, respectively.
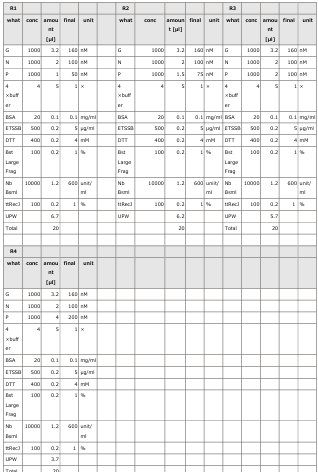
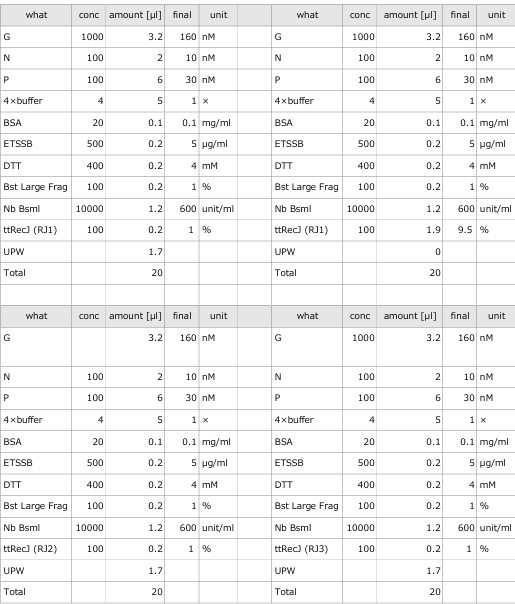
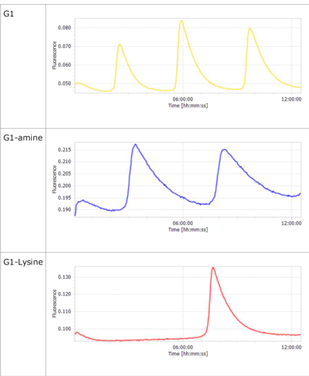
  • To evaluate the enzymatic activity of ttRecJ, an independent experiment was performed using Reaction 3 alone.
  • Oscillatory behavior was observed immediately after the reaction started; however, the concentration of P subsequently increased. In other words, P did not decrease, while the proportion of N declined.

3.2 Experiment 3-2

Objective of the experiment

  • Since oscillations were not observed in the previous experiment (Experiment 3-1), it was assumed that the concentrations of N and P were not appropriate. Therefore, the concentrations of these two DNAs were varied to examine whether oscillatory behavior could be observed.
Experiment 3-2 figure 1 Experiment 3-2 figure 2
Composition table
Graph of experimental results
  • The concentration of G was fixed at 160 nM across all reactions (R1–R4).
  • R1: N 50 nM, P 150 nM
  • R2: N 75 nM, P 225 nM
  • R3: N 100 nM, P 300 nM
  • R4: N 125 nM, P 375 nM
  • A sharp increase in the proportion of P was observed around 6 hours after the start of the reaction (as shown in the left graph).

3.3 Experiment 3-3

Objective of the experiment

  • Based on the results of Experiment 3-2, it was assumed that the ratio of N to P (1:3) provided an insufficient amount of N. Therefore, the ratio was adjusted to examine the effect of this change on the oscillatory behavior.
Experiment 3-3 figure 1 Experiment 3-3 figure 2
Composition table
Graph of experimental resultsThe concentrations of N and P in each reaction system were maintained within the range of 100–200 nM. The concentration of G was fixed at 160 nM, the same as in the previous experiment.
  • Even when the ratio of N to P was varied, the abrupt increase in the proportion of P persisted, and no oscillatory behavior was observed.

3.4 Experiment 3-4

Objective of the experiment

  • Due to the strong effect of Polymerase (Bst Large Fragment), degradation by Exonuclease (ttRecJ) is insufficient, resulting in a pronounced increase in P and the absence of oscillatory behavior.
  • It is anticipated that increasing the proportion of ttRecJ could produce behavior more closely resembling oscillations.
Experiment 3-4 figure 1 Experiment 3-4 figure 2
Composition table and Graph of experimental results
  • Description of the results
  • The DNA concentration was verified by measuring absorbance during dilution.
  • Compared with previous results, no significant changes were observed, and oscillatory behavior was not detected.

3.5 Experiment 3-5

Objective of the experiment

  • Oscillatory behavior was examined using ttRecJ at different concentrations, as well as with another ttRecJ preparation previously available in the laboratory.
  • The ttRecJ variants were as follows:
  • 2.5 μM dilution (RJ1)
  • Stock solution (8.7 μM) (RJ2)
  • Laboratory-available ttRecJ (RJ3)
Experiment 3-5 figure 1 Experiment 3-5 figure 2 Experiment 3-5 figure 3
Composition table and Graph of experimental results
  • Description of the results
  • Oscillations were observed with RJ3 during the first 6 hours.

3.6 Experiment 2-6

Objective of the experiment

  • Under the previously used compositional conditions, the action of Polymerase is dominant, and degradation by ttRecJ is insufficient, which is assumed to prevent oscillations.
  • Since mild oscillations were observed with RJ3, the type and concentration of ttRecJ were fixed, and the reaction was examined while varying the concentration of Polymerase.
Experiment 3-6 figure 1 Experiment 3-6 figure 2
Composition table and Graph of experimental results
  • Description of the results
  • Oscillatory waveforms were observed throughout the entire measurement period at 0.5% Polymerase.

3.7 Experiment 3-7

Objective of the experiment

  • The reaction system was examined by varying the concentration of Polymerase from 0.1% to 0.75%, compared with 1%.
Experiment 3-7 figure 1 Experiment 3-7 figure 2
Composition table and Graph of experimental results
  • Description of the results
  • Oscillations were observed at 0.75%, 0.5%, and 0.3% Polymerase.
  • The waveform at 0.75% Polymerase most closely matched the oscillation period reported in the reference [1].
  • Furthermore, oscillations at 0.75% exhibited less damping compared with those at other concentrations.

4. DNA oscillations with amino acid–modified template DNA

4.1 Experiment 4-1

Objective of the experiment

  • Oscillations were examined using unmodified G, G modified with an amino group, and G conjugated with Boc-protected Lysine, in order to assess whether these modifications affect the oscillation period.
Experiment 4-1 figure 1 Experiment 4-1 figure 2
Composition table and Graph of experimental results
  • Description of the results
  • Polymerase was used at 0.75%, and ttRecJ was RJ3.
  • A shift in oscillation period was observed for each modified G compared with unmodified G.
  • Compared with previous experimental results, the oscillation period of G was different.

4.2 Experiment 4-2

Objective of the experiment

  • Description of the results
  • Experiments were conducted under the same compositional conditions as Experiment 3-2, extending the PCR measurement time to 24 hours in order to observe the oscillation period over a longer duration.
  • The same experiments were also performed using RJ1 in place of RJ3.
Experiment 4-2 figure 1 Experiment 4-2 figure 2 Experiment 4-2 figure 3
Composition table and Graph of experimental results
  • Description of the results
  • The 4× buffer prepared on September 4 was freshly remade.
  • It was suspected that the freshly prepared buffer on the day of the experiment was responsible.
  • Specifically, when taking dNTPs from the stock to prepare the buffer, they may not have been mixed thoroughly.

4.3 Experiment 4-3

Objective of the experiment

  • The buffer was carefully remade, and the experiment was conducted under the same conditions as Experiment 4-2.

Composition table

  • The composition was the same as that used in Experiment 4-2.
Experiment 4-3 figure 1
Graph of experimental results
  • Description of the results
  • Under the RJ1 condition, an increase in P was observed.
  • Since Polymerase is dominant, the rate of DNA degradation by RJ1 is likely lower than the rate of P accumulation.
  • Under the RJ3 condition, the first hour showed behavior similar to G–Lysine, but the proportion of P increased thereafter. Compared with the results on Experiment 4-1, the oscillation period of G under the RJ3 condition was delayed.

4.4 Experiment 4-4

Objective of the experiment

  • The oscillation period of DNA oscillations was examined using G conjugated with Glycine (G–Glycine), in which the amino group of G is linked to Glycine.
Experiment 4-4 figure 1 Experiment 4-4 figure 2
Composition table and Graph of experimental results
  • Description of the results
  • DNA oscillations were not observed with the template DNA conjugated with Glycine.
  • Regarding the pulse observed with G, the timing was delayed compared with previous results.

5. Expression and purification of ttRecJ

Working dilution buffer composition (total 300 μL)
Component Stock Volume (μL) Final
Tris–HCl (pH 7.4) 1 M 3 10 mM
KCl 1 M 30 100 mM
EDTA 10 mM 3 0.1 mM
DTT 100 mM 3 1 mM
Triton X-100 10% 3 0.1%
Glycerol 150 50% (v/v)
Ultra-pure water (UPW) 108
Total 300

6. Reference

  1. Fujii T, Rondelez Y. Predator–Prey Molecular Ecosystems. ACS Nano (2013).